| |
|
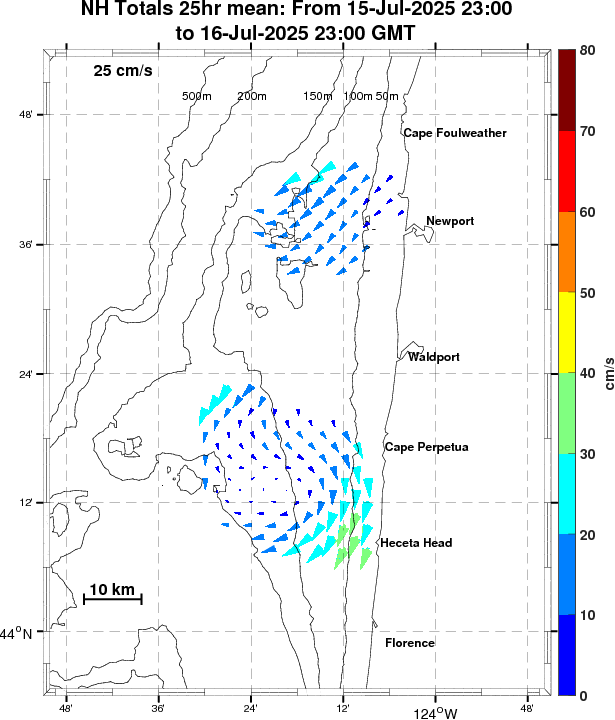
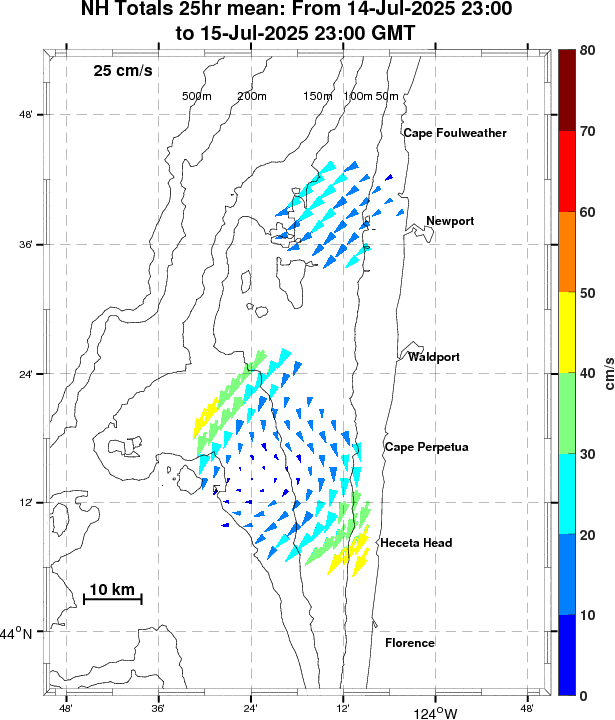
Speeds are in centimeters/second (1 knot = 51.4 cm/s). Maps show a region about 75km wide by 100 km long.
 Archived Maps plus ascii files Archived Maps plus ascii files
|
Winds near Newport
|
Funds for operation provided through NANOOS, the IOOS regional ocean observing system for the Pacific Northwest. |
PLEASE NOTE: these are research, rather than routine, measurements.
These near-real-time measurements have not been subjected to thorough
data checking. Their accuracy is not guaranteed; in fact, some errors
are to be expected. Treat them skeptically, and use at your own risk.
This material is based upon work supported by the National Science Foundation under Grant
No. 9907854. Any opinions, findings, and conclusions or recommendations
expressed in this material are those of the authors and do not necessarily reflect the views of
the
National Science Foundation.
 January
February
March
April
May
June
January
February
March
April
May
June
July
August
September
October
November
December
January
February
March
April
May
June
July
August
September
October
November
December
January
February
March
April
May
June
July
August
September
October
November
December
January
February
March
April
May
June
July
August
September
October
November
December
January
February
March
April
May
June
July
August
September
October
November
December
January
February
March
April
May
June
July
August
September
October
November
December
January
February
March
April
May
June
July
August
September
October
November
December
January
February
March
April
May
June
July
August
September
October
November
December
January
February
March
April
May
June
July
August
September
October
November
December
January
February
March
April
May
June
July
August
September
October
November
December
January
February
March
April
May
June
July
August
September
October
November
December
January
February
March
April
May
June
July
August
September
October
November
December
January
February
March
April
May
June
July
August
September
October
November
December
January
February
March
April
May
June
July
August
September
October
November
December
January
February
March
April
May
June
July
August
September
October
November
December
January
February
March
April
May
June
July
August
September
October
November
December
January
February
March
April
May
June
July
August
September
October
November
December
January
February
March
April
May
June
July
August
September
October
November
December
January
February
March
April
May
June
July
August
September
October
November
December
January
February
March
April
May
June
July
August
September
October
November
December
January
February
March
April
May
June
July
August
September
October
November
December
January
February
March
April
May
June
July
August
August
September
October
November
December
January
February
March
April
May
June
July
August
September
October
November
December
January
February
March
April
May
June
July
August
September
October
November
December
January
February
March
April
May
June
July
August
September
October
November
December
January
February
March
April
May
June
July
August
September
October
November
December
May
June
July
August
September
October
November
December
January
February
March
April
May
June
January
February
March
April
May
June
July
August
September
October
November
December
January
February
March
April
May
June
July
August
September
October
November
December
January
February
March
April
May
June
July
August
September
October
November
December
January
February
March
April
May
June
July
August
September
October
November
December
January
February
March
April
May
June
July
August
September
October
November
December
January
February
March
April
May
June
July
August
September
October
November
December
January
February
March
April
May
June
July
August
September
October
November
December
January
February
March
April
May
June
July
August
September
October
November
December
January
February
March
April
May
June
July
August
September
October
November
December
January
February
March
April
May
June
July
August
September
October
November
December
January
February
March
April
May
June
July
August
September
October
November
December
January
February
March
April
May
June
July
August
September
October
November
December
January
February
March
April
May
June
July
August
September
October
November
December
January
February
March
April
May
June
July
August
September
October
November
December
January
February
March
April
May
June
July
August
September
October
November
December
January
February
March
April
May
June
July
August
September
October
November
December
January
February
March
April
May
June
July
August
September
October
November
December
January
February
March
April
May
June
July
August
September
October
November
December
January
February
March
April
May
June
July
August
September
October
November
December
January
February
March
April
May
June
July
August
September
October
November
December
January
February
March
April
May
June
July
August
September
October
November
December
January
February
March
April
May
June
July
August
August
September
October
November
December
January
February
March
April
May
June
July
August
September
October
November
December
January
February
March
April
May
June
July
August
September
October
November
December
January
February
March
April
May
June
July
August
September
October
November
December
January
February
March
April
May
June
July
August
September
October
November
December
May
June
July
August
September
October
November
December